


 Back
;)
For decades, retailers have relied on heatmaps to understand how shoppers move through their stores, where they spend time, and which areas draw the most activity. These 2D visualizations can give a useful overview, but traditional methods often paint an incomplete and sometimes misleading picture of shopper behavior.
The problem is how the activity is measured. When heatmaps rely on accumulated activity within individual camera views, they can conflate shopper volume with dwell time and fail to tell shoppers apart from employees.
Standard AI’s VISION platform takes a different approach, using computer vision and 3D spatial reconstruction to map shopper movement through the store more precisely, and accurate heatmaps are just the start of what it reveals.
What Are Retail Heatmaps?
Retail heatmaps are visual representations of activity inside a store. They help retailers see where activity concentrates and use that to understand how shoppers move through the space.
Traditional heatmaps turn camera footage into a 2D representation of activity across the store. That can show which areas appear busiest, but the visualization doesn’t always tell the full story of what shoppers are actually doing there.
How Traditional Retail Heatmaps Work
Many traditional systems build heatmaps by measuring activity within individual camera views and combining that data into a larger map of the store.
The approach is similar to a long-exposure photograph. Activity accumulates over time, creating areas of higher or lower concentration on the resulting map.
The result shows where activity accumulated over time, which sets the stage for how these maps can be misread.
How Traditional Heatmaps Are Misleading Retailers
Heatmaps today attempt to show retailers how shoppers are moving through their stores, but several fundamental flaws in data collection and processing mislead retailers into thinking they are looking at shopper movements when they are not.
It Can’t Connect Shoppers Across Cameras
Most heatmap systems can’t correlate a shopper seen in one camera view with that same shopper in another. Since most stores are large enough to need multiple cameras across the floor, this is an immediate problem: with no way to connect shoppers between views, it’s impossible to build a heatmap based on shopper pathing, the actual path each shopper took through the store.
Instead, these systems measure dwell time within each camera view separately, then combine those views into a single map.
It Confuses Dwell Time With Traffic
Once you understand how these maps are made, the flaws become apparent. A single shopper standing in one spot for a long time can produce the same measure of “traffic” as multiple shoppers moving more quickly through an area.
It Can’t Tell Shoppers From Employees
This problem is only compounded when you consider these same systems cannot differentiate between actual shoppers and store employees.
Imagine, as a retailer, looking at a heatmap and interpreting a particular end cap as highly trafficked and therefore as a good spot for promoting new products, when in fact, what you were really seeing was your own employee restocking shelves or conducting routine tasks.
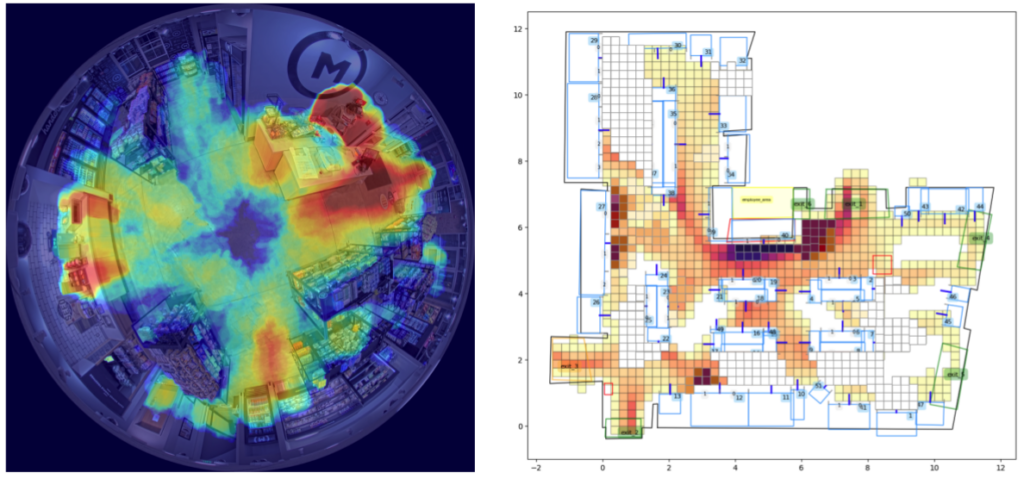
Figure 1 shows an example heatmap created using this long-exposure technique. On the left, we see the heatmap overlaid on the camera view itself, and on the right, we can see that same data flattened to a 2D map grid over the store layout.
Based on the data above, you might reasonably conclude that, beyond the checkout counter in the middle of the floorplan, traffic concentrates near the coffee stations (on the left of both images) and the shelf sections nearest the bottom left exit.
How VISION Creates More Accurate Retail Heatmaps
Standard AI’s VISION platform takes a different approach. Instead of treating each camera as an isolated source of activity, VISION uses computer vision and 3D spatial reconstruction to model shopper movement across the entire store.
It Builds a 3D Model of the Store
VISION creates a 3D model of the store for a more complete representation of the space. This helps eliminate blind spots in camera coverage and gives retailers a broader view of traffic patterns throughout the store.
It Tracks Shoppers Across Camera Views
VISION’s 3D spatial reconstruction maintains a continuous, anonymized track of shoppers and employees as they move from one camera view to the next, making it possible to understand shopper pathing across the store rather than as disconnected fragments.
It Distinguishes Shoppers From Employees
VISION’s machine learning models are built to distinguish shopper and employee movement, so staff activity like restocking or routine tasks doesn’t get mistaken for shopper traffic.
It Maps Actual Shopper Paths
Because VISION tracks each shopper through the store, its heatmaps represent actual shopper paths, showing the traffic patterns real shoppers create rather than where activity piled up.
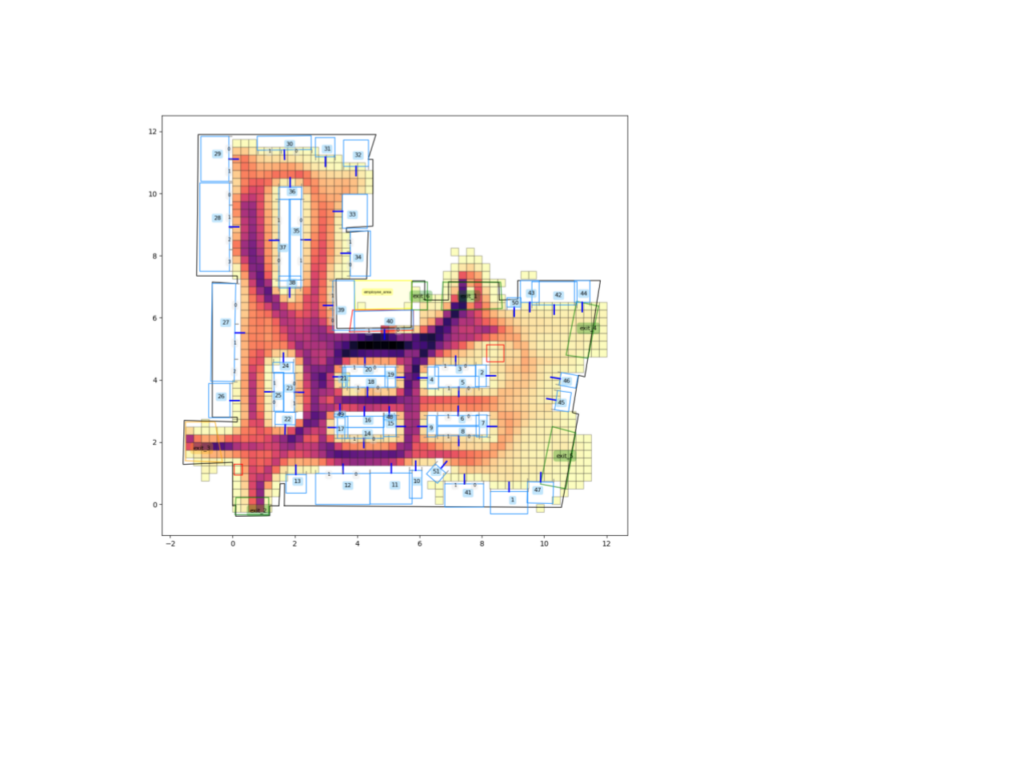
Figure 2 illustrates true traffic patterns, counting actual traffic through each grid on the floor rather than conflating dwell time with traffic. Compared to Figure 1, the concentration around the coffee bar turns out to be just long dwell, not actual traffic, shoppers there open and stir in milk and sugar, fiddle with the lid, and heat their coffee, while employees straighten condiments and wipe the counter. A long-exposure heatmap hides this.
It Measures Where Shoppers Actually Stop
Beyond mapping paths, VISION can also measure how often shoppers stop in each area, a different signal from dwell time.
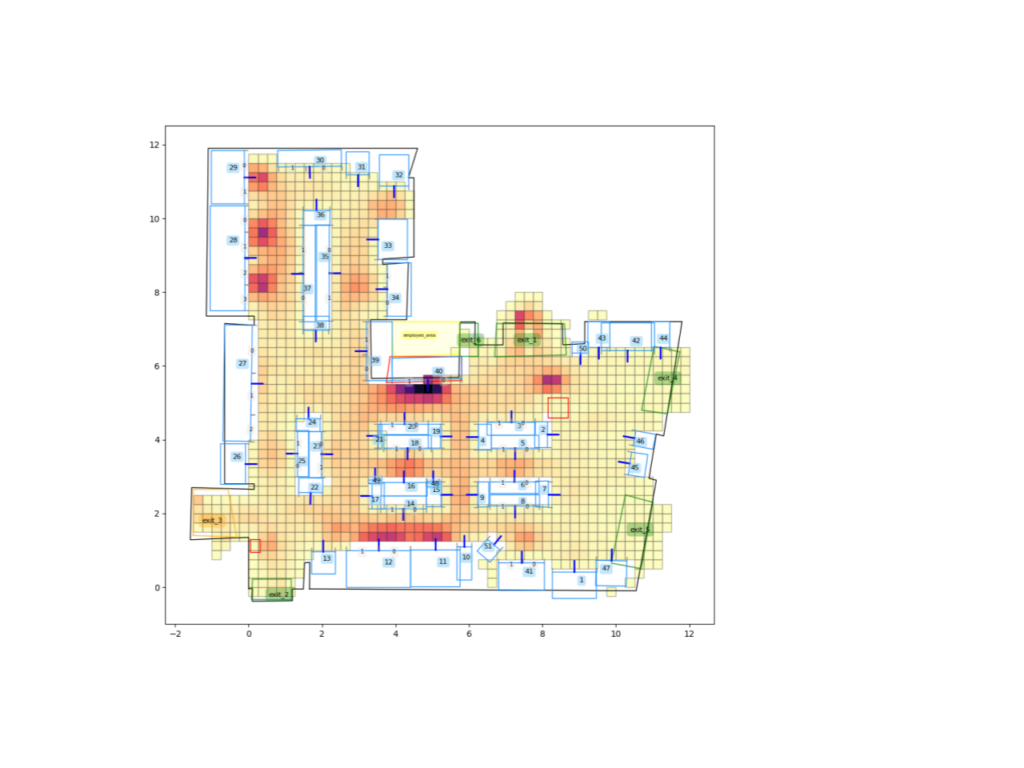
Taking this one step further, VISION can also count the frequency of stops within the space. Figure 3 illustrates the areas in which most shoppers stopped, regardless of dwell time. It shows more distinctly that it’s really the dwell time of a few shoppers at the coffee bar skewing the numbers, and that more shoppers actually stop near the coolers in the top-left and bottom-middle of the floorplan.
Learn more about the VISION analytics platform by Standard AI
What VISION Heatmaps Can Reveal
Beyond mapping where shoppers go and where they stop, VISION adds behavioral context that traditional heatmaps can’t.
Dwell Time in Context
Dwell time still matters, but it needs the context of movement. Time spent waiting in a queue or preparing a coffee shouldn’t carry the same weight as time spent considering products on a shelf. VISION’s shopper modeling adds that behavioral context.
Shopper Pathing & Behavior
VISION models individual shopper movement and measures changes in factors like velocity and orientation, building a richer view of behavior including transiting, impression formation, and queueing. That lets retailers and CPGs move beyond basic traffic visualization to measure in-store shopper behavior in detail.
Privacy by Design
Understanding shopper behavior doesn’t require identifying individual shoppers. VISION uses 3D representations and computer vision to anonymously track movement, without facial recognition or other sensitive biometrics. Retailers can understand where people are in the store and how they move through it, without ever knowing who those individuals are.
What’s Next for Retail Heatmaps?
Traditional heatmaps helped retailers visualize activity, but showing where activity accumulates doesn’t capture the full picture of shopper behavior.
Computer vision and 3D shopper modeling take heatmaps further, connecting activity across camera views, distinguishing shoppers from employees, mapping actual paths, and measuring additional aspects of behavior. For retailers and CPGs, the more advanced retail heatmap is less about where activity concentrates and more about how shoppers move through the store and what they do when they get there.
See What VISION Can Reveal About Your Store
Standard AI’s VISION platform uses computer vision to turn existing camera footage into detailed insights about shopper movement and behavior. See how VISION can help your team move beyond traditional heatmaps and get a clearer view of what’s happening inside your stores.